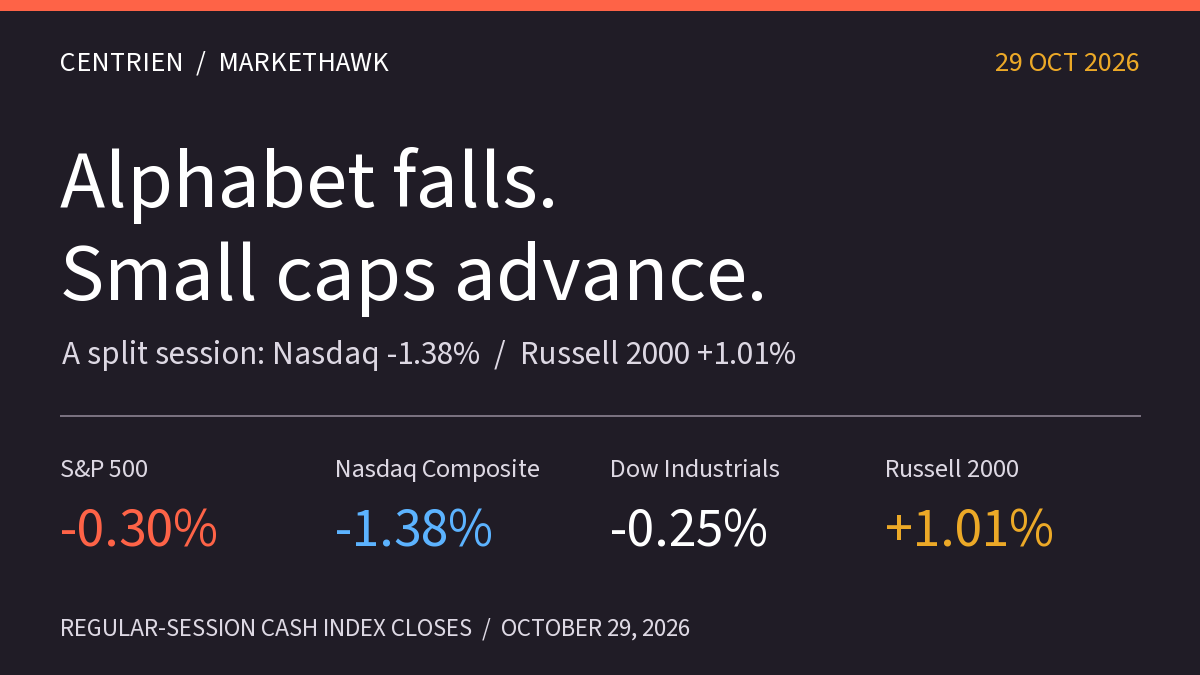
Alphabet’s 12.64% decline pulled the Nasdaq Composite down 1.38% on Thursday, but the selling did not extend evenly across the market. Small caps gained 1.01%, and nine of the eleven Select Sector SPDR funds finished higher. The day’s central distinction was concentration: weak headline indexes alongside gains in much of the sector board.
Alphabet’s loss overshadowed gains elsewhere
Alphabet’s Class A shares closed at $283.82, down $41.07, following Wednesday evening’s earnings release. AP identified the company as the principal drag on the market. Microsoft’s response was much smaller: its shares finished at $530.14, down 0.16%.
The sector breakdown helps explain why a single description of “stocks down” misses so much of this session. Health care’s XLV rose 2.40%, real estate’s XLRE gained 2.21%, and consumer staples’ XLP added 1.54%. Financials’ XLF advanced 1.44%.
Against those gains, communication services’ XLC fell 1.87% and technology’s XLK lost 1.18%. Alphabet is represented in communication services, so its decline should not be described solely as a technology-sector event. These figures are regular-session ETF price returns, used as sector proxies; they exclude dividends and are distinct from the underlying sector indexes.
The Russell gained as the three large benchmarks fell
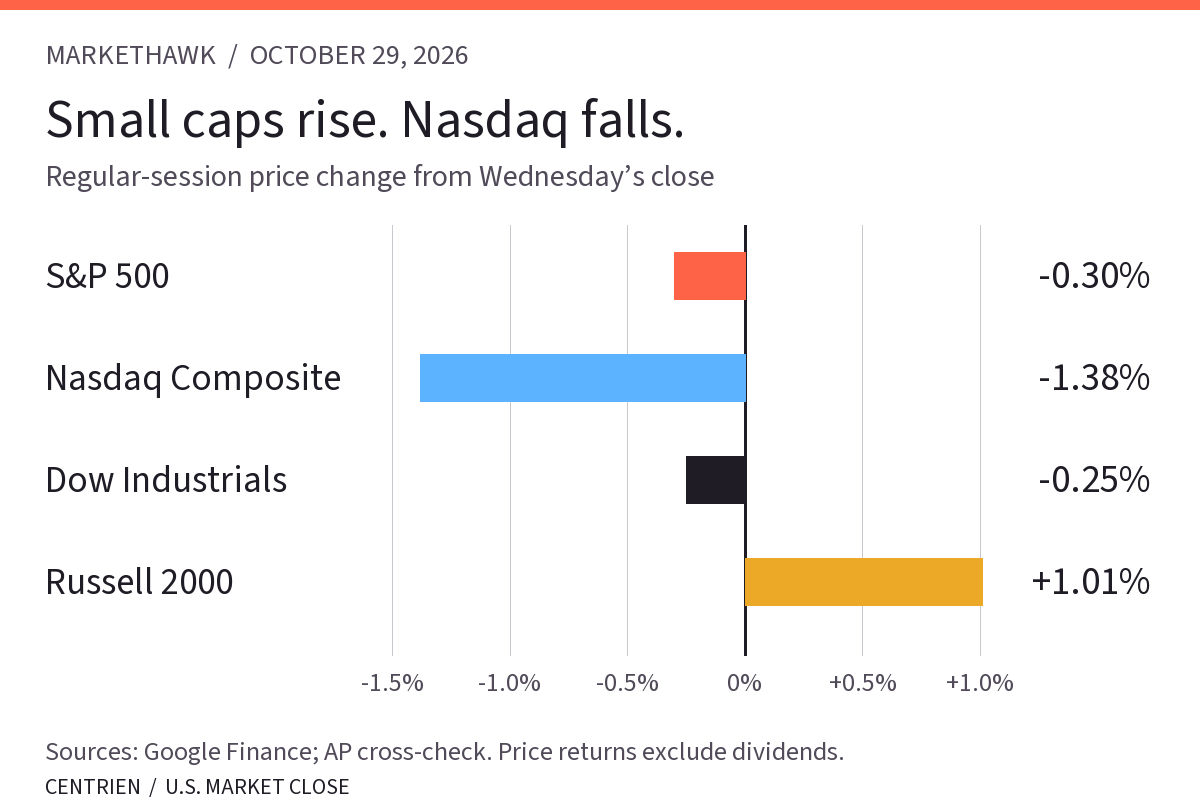
The S&P 500 lost 0.30%, the Dow 0.25% and the Nasdaq Composite 1.38%. The Russell 2000 moved the other way, gaining 1.01%. The AP closing scorecard corroborates the cash-index levels and point changes below.
| Index / source | Close | Point change | Price change |
|---|---|---|---|
| S&P 500 | 7,720.39 | -23.59 | -0.30% |
| Nasdaq Composite | 26,184.72 | -365.13 | -1.38% |
| Dow Industrials | 52,342.56 | -132.54 | -0.25% |
| Russell 2000 | 2,859.22 | +28.71 | +1.01% |
The Nasdaq–Russell gap was 2.39 percentage points, calculated from the displayed daily returns. That is a substantial difference between benchmarks on the same day. It does not, by itself, measure the number of advancing shares or demonstrate that every smaller company benefited.
Faster growth arrived with firmer annual inflation
BEA’s advance estimate put third-quarter real GDP growth at a 3.4% annual rate, compared with 2.2% in the second quarter. Investment, household spending and government spending contributed to the expansion; declining exports partly offset those gains. Annualized growth scales the quarter’s pace to a year—it does not mean output increased 3.4% in three months.
The household data provided a different time horizon. Personal income rose 0.2% in September and nominal consumer spending increased 0.5%. Meanwhile, the headline PCE price index was 3.6% above a year earlier, up from 3.4% in August. Core PCE inflation increased to 3.1% from 3.0%.
Those releases leave two separate policy questions: how much demand the economy can sustain, and whether price pressure is easing. Stronger quarterly output does not resolve the inflation question. Nor should nominal spending growth be read as an equivalent increase in the volume of goods and services purchased.
The Labor Department reported 194,000 initial unemployment claims for the week ended October 24, down 1,000 from the revised prior week. The four-week average fell to 196,750. These weekly claims track new benefit applications, rather than the monthly unemployment rate.
Treasury yields declined, AP reported. The VIX observation was 17.20, up 0.29 point, at 3:15 p.m. Central. Google Finance’s NYMEX continuous crude series, CLW00, stood at $102.86 a barrel, up 0.08%, at 4:00 p.m. Central. The oil figure is a timestamped futures-series quote, not a settlement.
Amazon’s cloud growth came with a cash-flow tradeoff
After regular trading, Amazon reported third-quarter sales of $201.9 billion, up 12%, and operating income of $28.1 billion. AWS sales reached $46.0 billion, with growth of 39.3%. Net income was $20.7 billion, or $1.89 per diluted share.
The same release reported trailing-twelve-month free cash outflow of $42.4 billion, reflecting higher property and equipment spending, primarily for artificial intelligence. The operating result and the cash outflow answer different questions: the former describes earnings from the business, while the latter includes the cost of expanding its infrastructure. These results arrived after Thursday’s cash-index close and were not part of the returns in the scorecard.
Labor costs and energy earnings close the week
The next regular U.S. equity session is Friday, October 30. Confirmed events, in Central time:
- 7:30 a.m.: The third-quarter Employment Cost Index, which adds a labor-compensation measure to Thursday’s growth and inflation releases.
- 8:45 a.m.: October’s Chicago Purchasing Managers’ Index.
- Friday earnings: ExxonMobil’s third-quarter financial results, confirmed by the company’s release notice.
Friday will bring the first regular-session response to Amazon’s report. The useful comparison is whether the wider participation seen Thursday persists alongside pressure on the largest growth stocks, rather than whether a single index erases its loss.
Keep reading.
Your Access List Is a Museum. Time to Clean It Out.
An access review needs more than a list of active employees. Supplier accounts, service identities, inherited permissions, and active sessions can preserve access after the original reason has ended.
3 min read →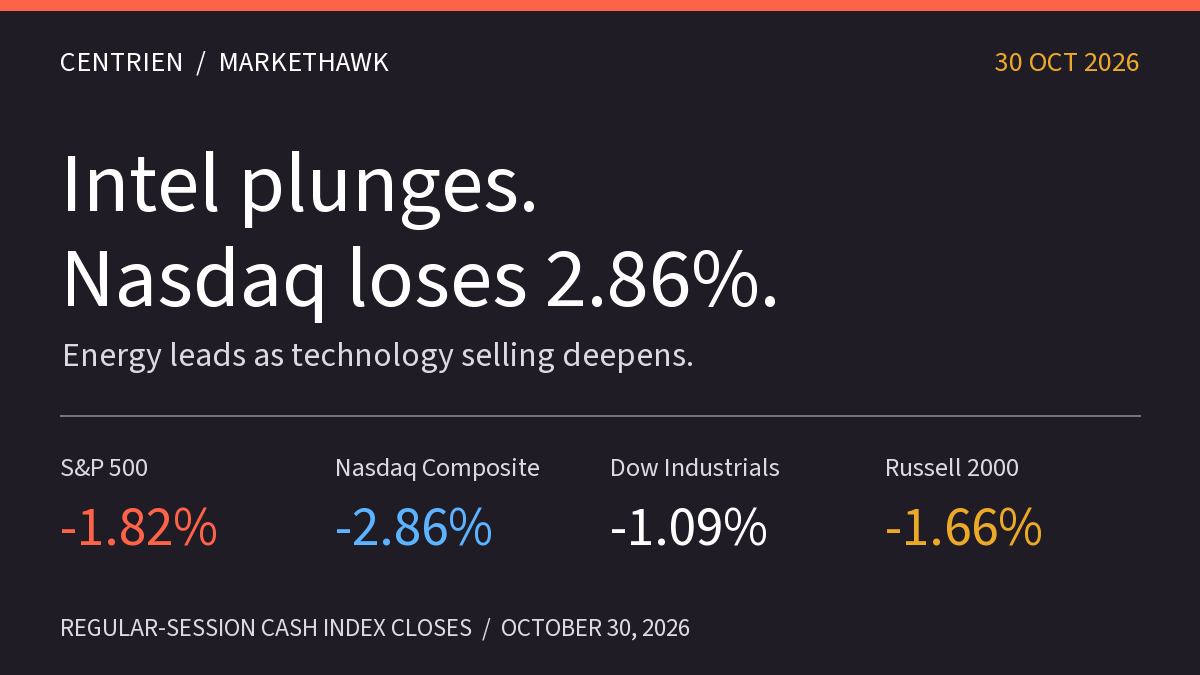
October 30 market close: Intel plunges, Nasdaq falls 2.86%
Intel falls 28.58% as its outlook weighs on technology. Nasdaq loses 2.86%, energy leads sector gains, and labor-cost data and weekly returns frame the Friday close.
4 min read →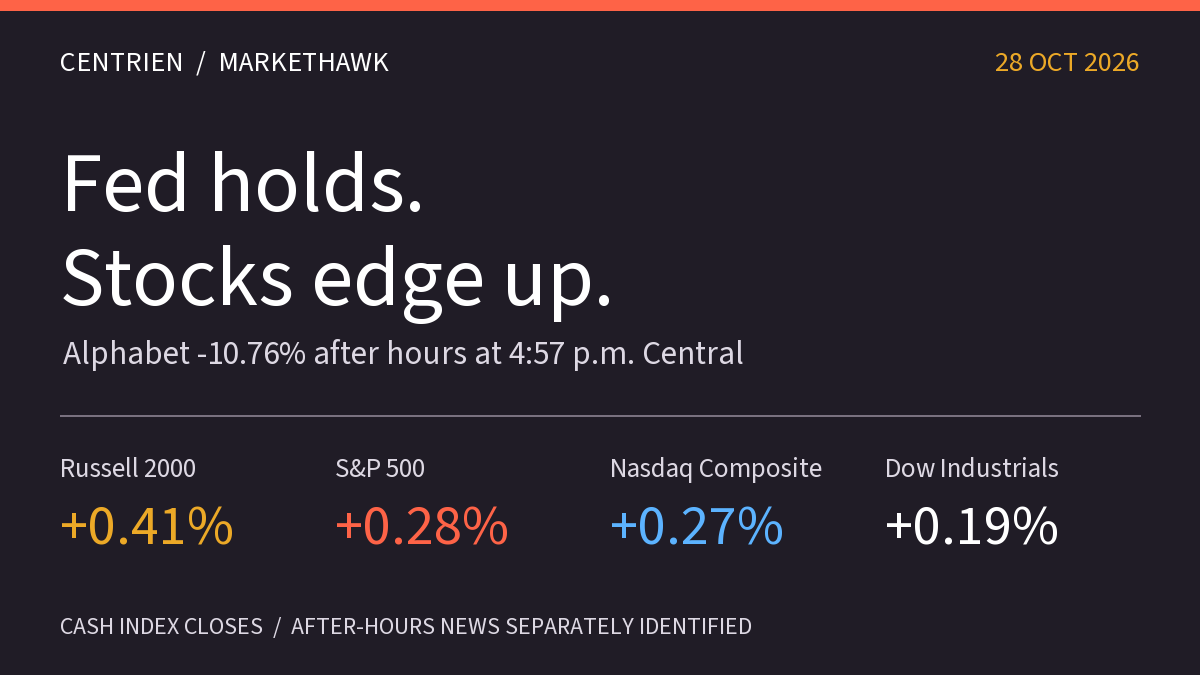
October 28 market close: Fed holds, Alphabet drops after hours
The Fed holds rates at 3.75%–4.00% in a split vote. Cash indexes edge higher, while Alphabet’s late after-hours decline sets a different test ahead of Thursday’s GDP and inflation data.
4 min read →