Centrien Insight
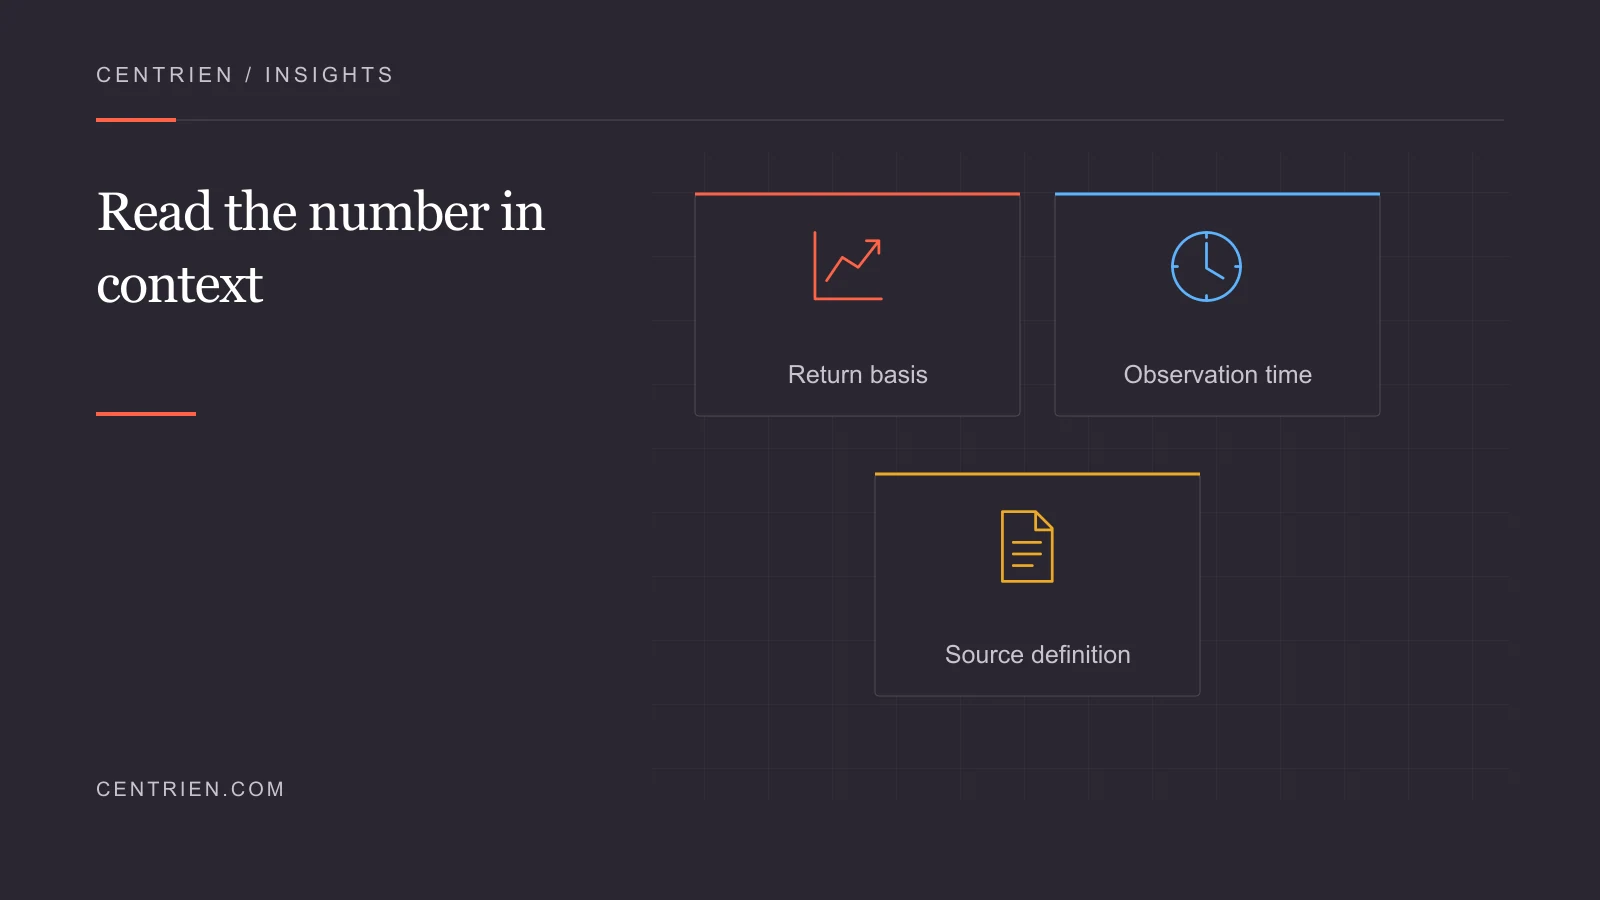
Before comparing market numbers, establish what was measured, over which interval, and on which basis.
A daily market recap can combine equity price returns, bond yields, commodity observations, and after-hours news. Those values answer different questions and may refer to different times. Check the instrument, session, currency, and calculation basis before comparing numbers. A yield change needs its unit, and a closing price needs its market session. Trace a material statement back to the linked source when the definition is unclear.
Separate a level from a return
An index level is a point on a defined scale. A point change compares levels; a percentage change divides that change by the earlier level. Compare percentages across indices rather than assuming equal point moves imply equal performance. S&P Dow Jones Indices explains that index methodology governs calculation and that total-return versions account for reinvested distributions as well as price movement. Match the exact return series before comparing two reported results. A price-return index and a total-return fund result answer different questions.
Read yields in the right units
A yield level expressed as a percentage is not the same measure as the percentage change in a stock index. One basis point is one hundredth of a percentage point. For example, an illustrative move from 4.20% to 4.30% is a rise of 10 basis points, not 10%. Treasury’s published par curve has a specific estimation methodology; it should not be relabeled as an executable quote for one particular bond. Keep maturity, nominal or real basis, observation date, and source definition with the figure.
Respect the session and the cutoff
Keep the exchange calendar, time zone, and observation time with a closing figure. Early-close sessions are shorter, and after-hours company developments may arrive after a regular equity close. A report’s information cutoff states which developments were available to the writer; it does not change when each underlying market observation occurred. For MarketHawk daily reports, distinguish the regular-session scorecard from developments known by the 5:00 p.m. Central cutoff. Consult the official exchange calendar for the actual session rather than assuming every weekday is a full trading day.
Treat interpretation as a separate layer
A market move and a same-day headline do not establish a causal relationship on their own. Look for the sequence of information, the relevant instrument, and whether other important events occurred. A recap can explain a plausible interpretation without presenting it as a measured fact. When a chart compares sectors or benchmarks, verify the data universe, currency, distribution treatment, and period. This reading discipline helps compare reports consistently; it does not establish the suitability of a trade or predict the next session.
Put the plan into practice
- Identify the series Read the instrument, return basis, and source definition.
- Normalize the comparison Use matching periods and units; preserve each observation time.
- Separate fact and explanation Distinguish the reported measurement from the writer’s interpretation.
| Review area | Useful observation | Accountable role |
|---|---|---|
| Equity index return | Percentage change over a named session | Index provider and series |
| Treasury yield | Yield level and basis-point change | Maturity, methodology and date |
| Market narrative | Interpretation of observed conditions | Attributed facts and timing |
Worked example
Illustrative inputs. Using illustrative levels only, a move from 5,000 to 5,050 is 50 points and 1%. A move from 10,000 to 10,050 is also 50 points but 0.5%. The same point change describes different relative moves. Preserve both levels and the calculation when checking a recap.
What a useful outcome looks like
A useful recap makes its comparisons reproducible: the series, date, period, units, source, and cutoff are visible. If one of those is missing, resolve it before treating two figures as directly comparable.
Choose one recap and reconcile its headline move with the underlying source. Keep the instrument and timing visible when using that number in another analysis.
References
Keep reading.
Your Access List Is a Museum. Time to Clean It Out.
An access review needs more than a list of active employees. Supplier accounts, service identities, inherited permissions, and active sessions can preserve access after the original reason has ended.
3 min read →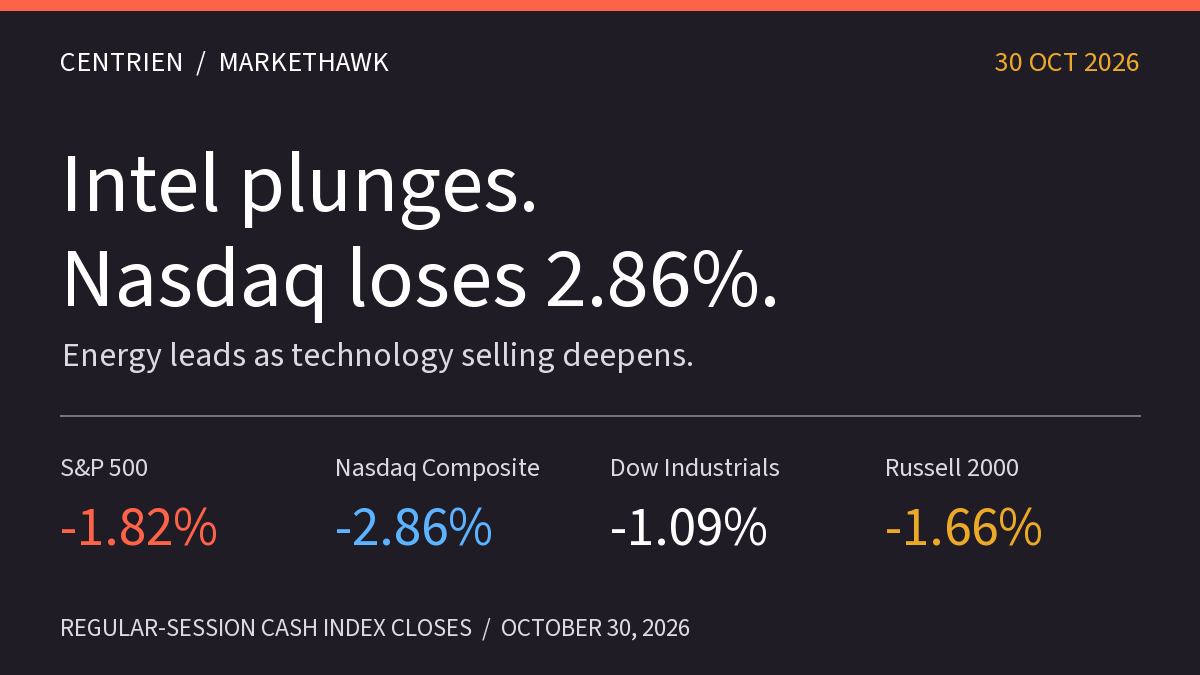
October 30 market close: Intel plunges, Nasdaq falls 2.86%
Intel falls 28.58% as its outlook weighs on technology. Nasdaq loses 2.86%, energy leads sector gains, and labor-cost data and weekly returns frame the Friday close.
4 min read →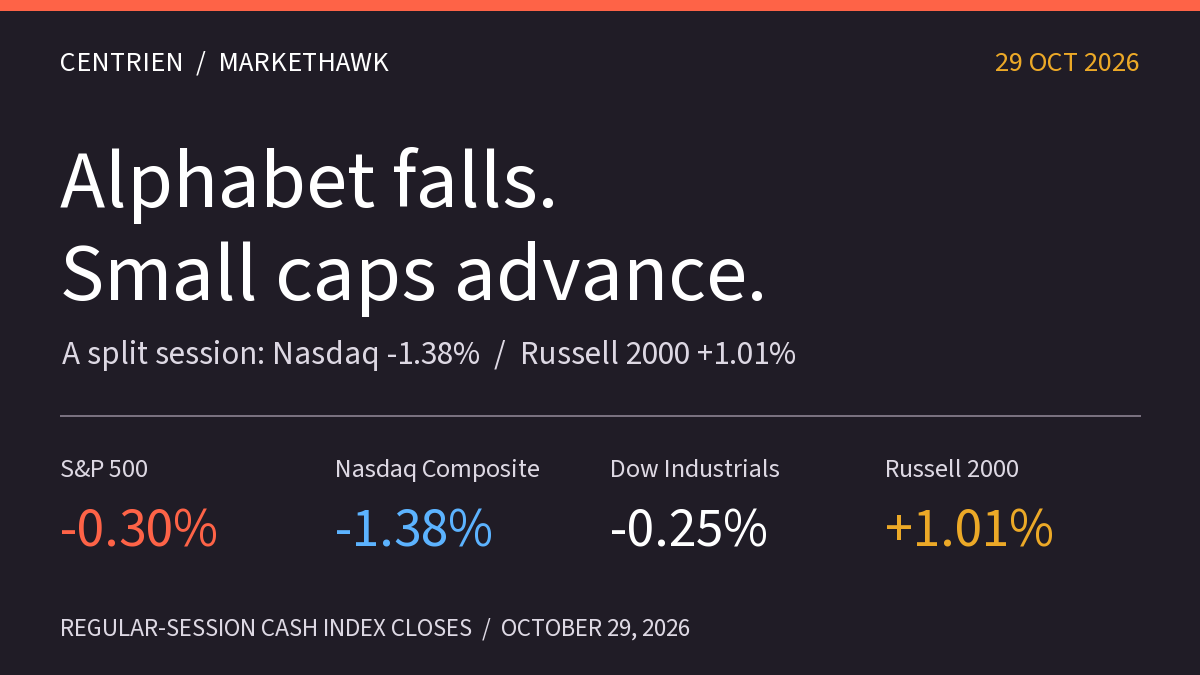
October 29 market close: Alphabet sinks, small caps advance
Alphabet falls 12.64% and the Nasdaq loses 1.38%, while small caps and nine sector ETFs gain. GDP, inflation and Amazon earnings frame a sharply divided session.
4 min read →