A market observation needs a definition
Two screens can show different values for the same instrument without either number being a simple error. Observation time, market session, currency, adjustments, and return methodology can all change what the number means.
Preserve those definitions alongside the source value and receipt time. Test missing intervals, corrections, and stale observations before feeding the data into analysis. An AI model cannot resolve a mismatch that the reporting process has failed to identify.
Put it into practice
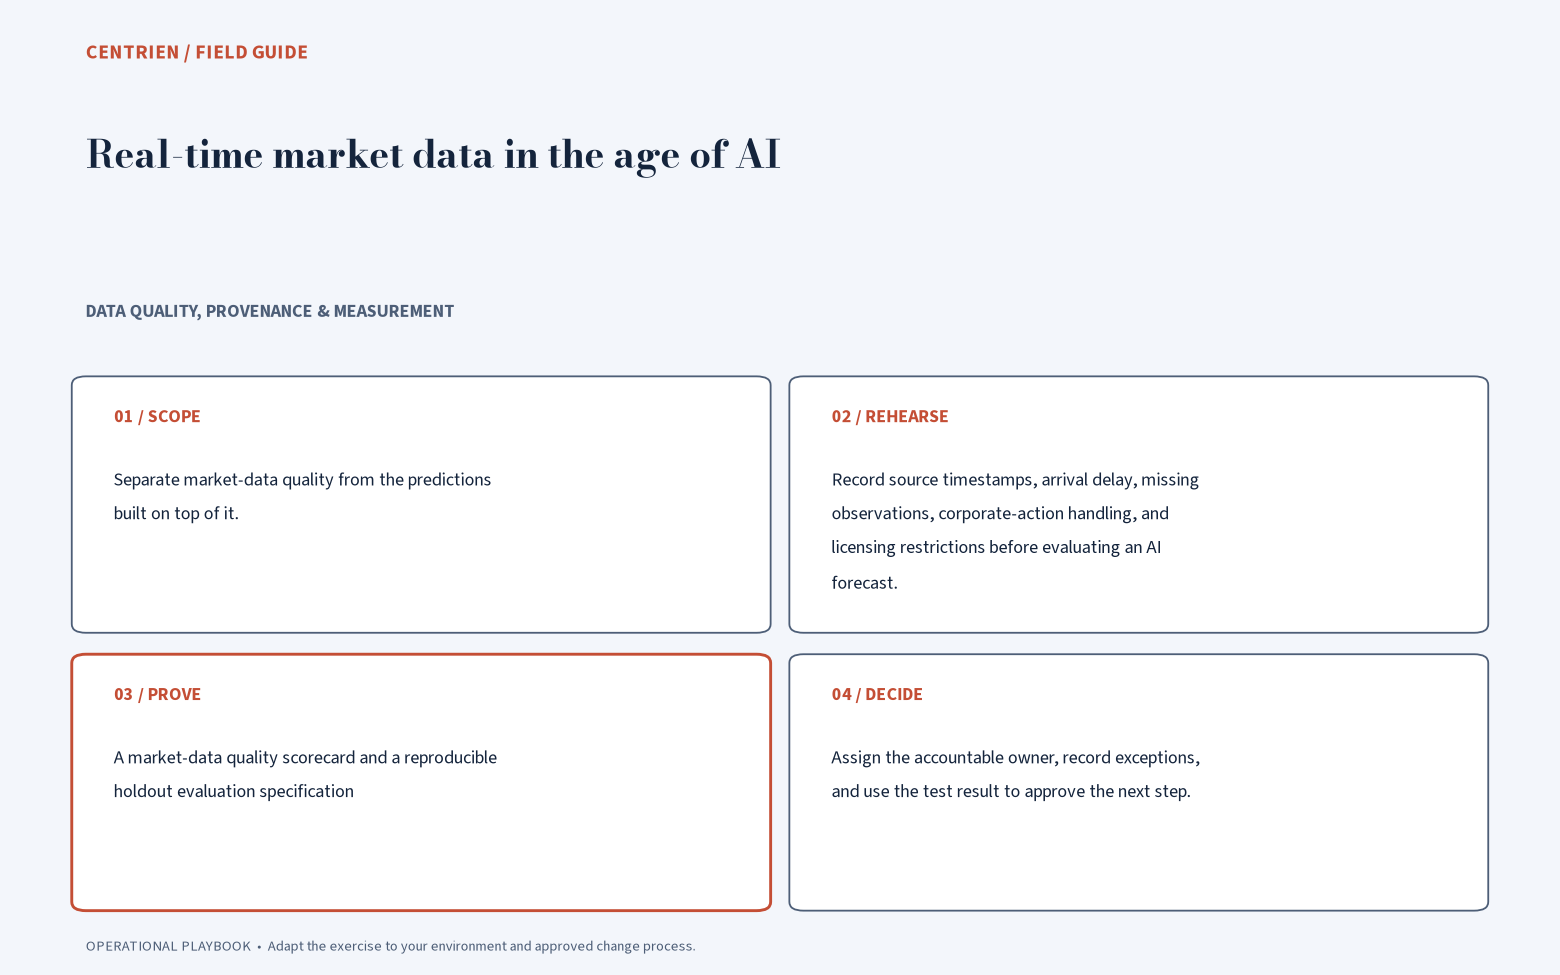
Record source timestamps, arrival delay, missing observations, corporate-action handling, and licensing restrictions before evaluating an AI forecast. Use chronological holdouts and preserve a reproducible baseline. Correcting a data defect is not proof of predictive skill.
Implementation steps
- Specify the data contractDefine the source, permitted uses, schema, identifiers, timestamps, refresh expectations, and correction policy. Identify the systems and decisions that depend on each field.
- Preserve the raw observationRetain the original record and transformation lineage. Check duplicates, missing intervals, units, time zones, adjustment logic, and late arrivals before interpreting an apparent business or security trend.
- Test against a referenceReconcile a bounded sample with an authoritative source or agreed control totals. For prediction work, keep later-period evaluation separate from development data and compare with a simple baseline.
- Make quality actionableSet an owner and response for stale, incomplete, or conflicting data. Distinguish unknown coverage from a clean result. Version corrections so a reviewer can reproduce the report that informed a decision.
Track completeness and freshness
| Measure | Calculation or definition | How to use it |
|---|---|---|
| Completeness | Valid expected observations received / observations expected | Define the observation window and known exclusions. |
| Freshness | Receipt time minus source event time | Separate source latency, transport latency, and processing delay. |
| Reconciliation accuracy | Records matching the agreed reference / records checked | Report material mismatches and transformation assumptions. |
Example data-quality acceptance
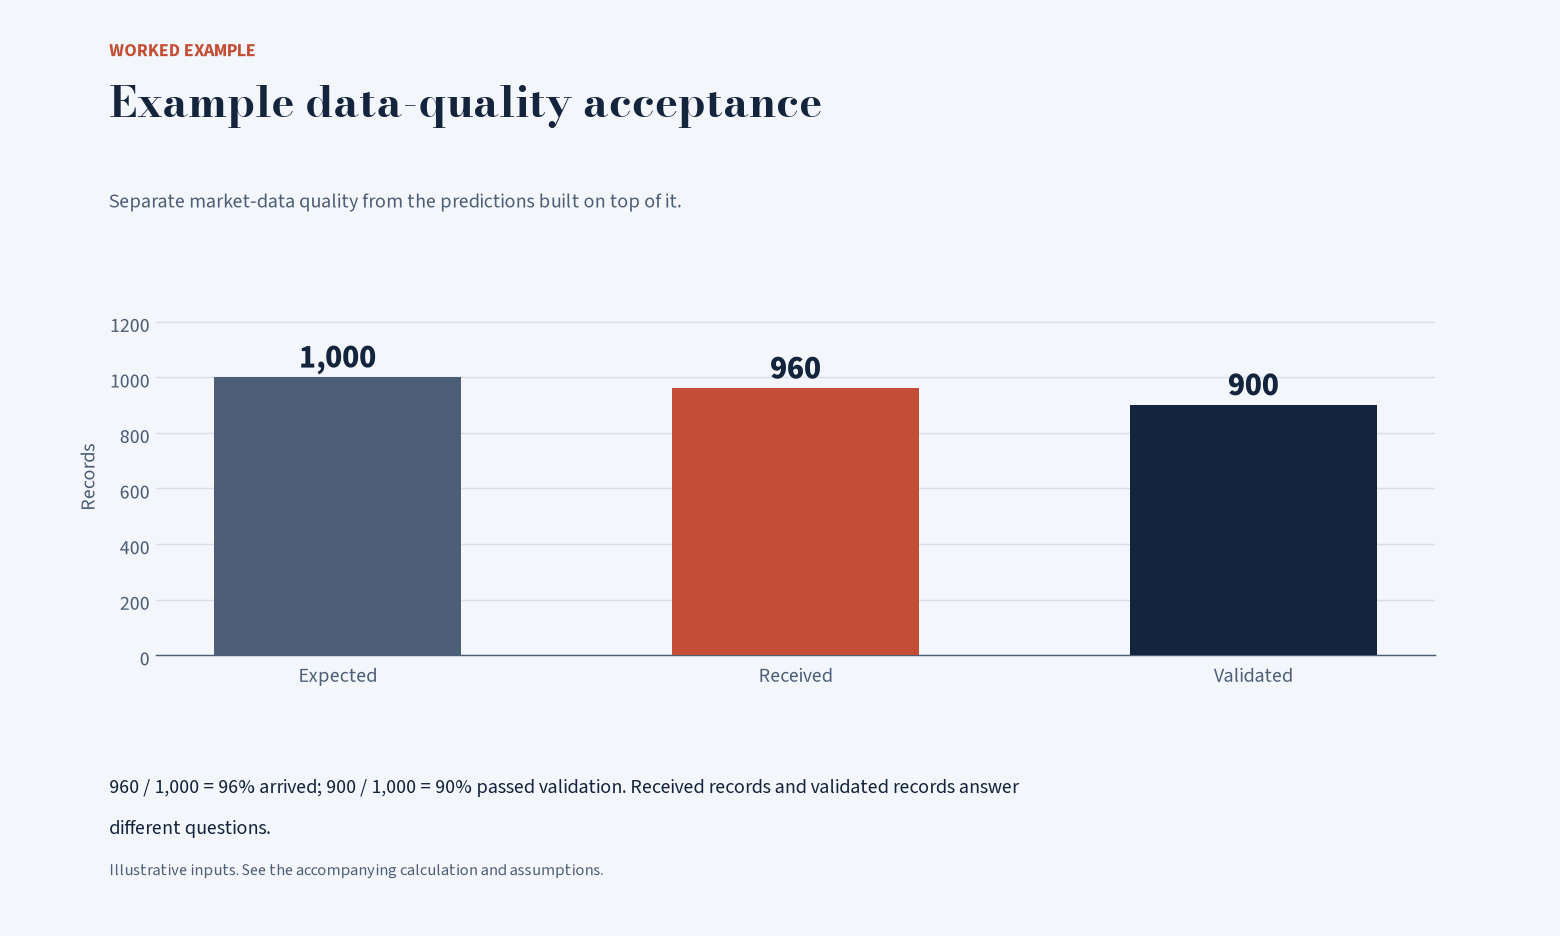
Worked example. Figures are illustrative.
| Observation | Records |
|---|---|
| Expected | 1,000 |
| Received | 960 |
| Validated | 900 |
Evaluate data quality and model performance separately.
The record to keep
The deliverable: A market-data quality scorecard and a reproducible holdout evaluation specification.
Choose a small set of instruments and reconcile a full session across the proposed sources. Resolve differences in meaning before using the feed to support an analytical conclusion.
References
- NIST Cybersecurity Framework — Use outcomes and organizational context to organize the risk discussion; a framework mapping is not a control test.
- NIST AI Risk Management Framework — Use lifecycle governance and evaluation appropriate to the proposed AI use case.
Keep reading.
Your Access List Is a Museum. Time to Clean It Out.
An access review needs more than a list of active employees. Supplier accounts, service identities, inherited permissions, and active sessions can preserve access after the original reason has ended.
3 min read →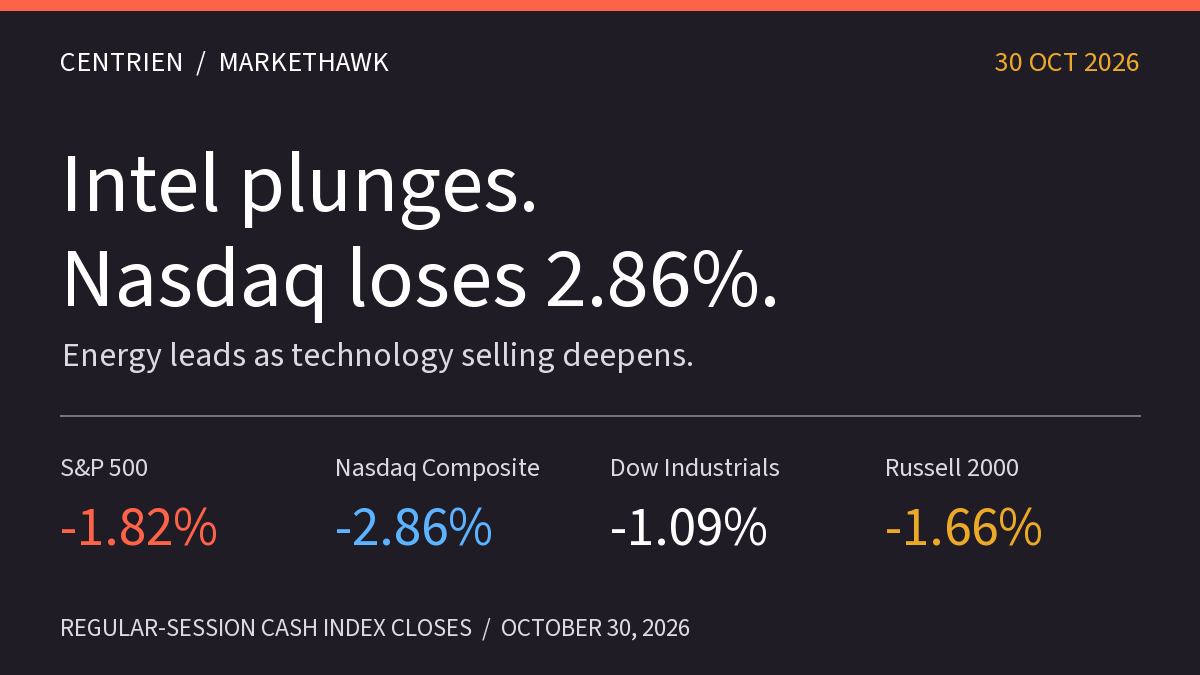
October 30 market close: Intel plunges, Nasdaq falls 2.86%
Intel falls 28.58% as its outlook weighs on technology. Nasdaq loses 2.86%, energy leads sector gains, and labor-cost data and weekly returns frame the Friday close.
4 min read →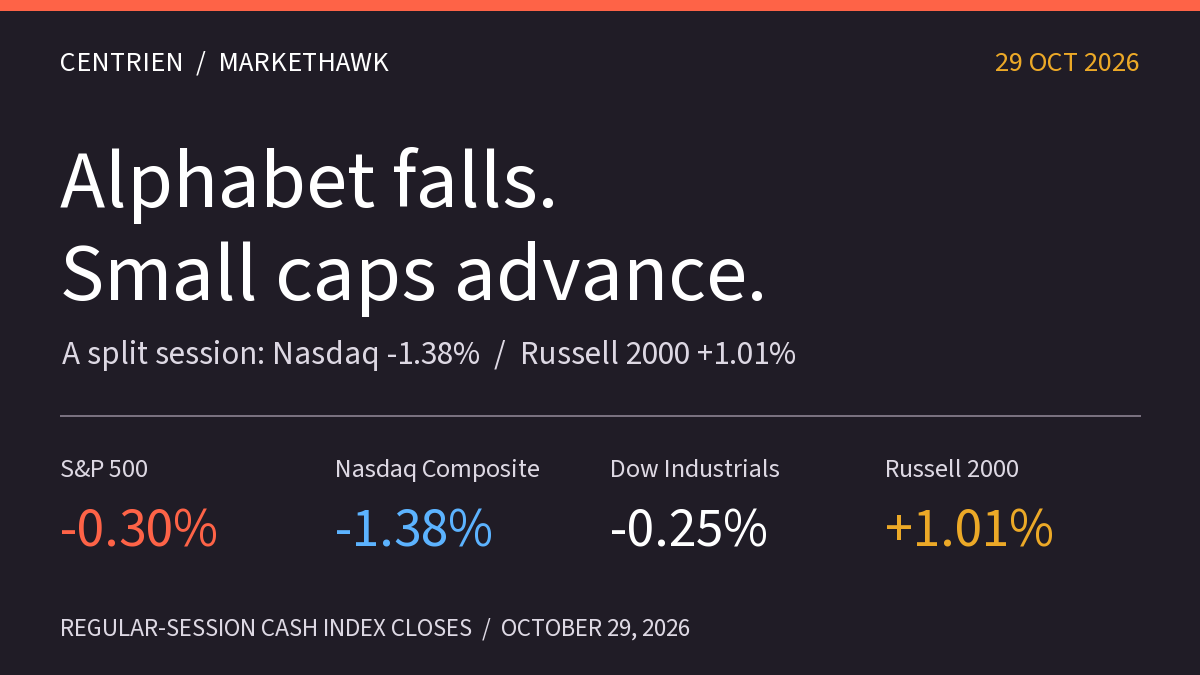
October 29 market close: Alphabet sinks, small caps advance
Alphabet falls 12.64% and the Nasdaq loses 1.38%, while small caps and nine sector ETFs gain. GDP, inflation and Amazon earnings frame a sharply divided session.
4 min read →